A Guide to DEBUG
( The Microsoft® DEBUG.EXE Program )
Copyright©2004,2007,2009,2017 by Daniel B. Sedory
This page may be freely copied for PERSONAL use ONLY !
( It may NOT be used for ANY other purpose unless you have
first contacted and received permission from the author ! )
In
1980, Tim Paterson began working on a 16-bit OS for the 8086 S-100 Bus card
he had designed for SCP (Seattle Computer Products) the
previous year. To help in getting QDOS
(later called 86-DOS) to work correctly, Tim created a debugger in a ROM chip;
the code for that ROM version was released into the Public Domain. Later, Tim
adapted the code to run as a .COM program under QDOS, and also added the ability
to disassemble 8086 machine code. In the meantime, Microsoft® had
been busy purchasing the rights to sell Tim's QDOS to IBM®
for their 'secret' PC project. Tim was then hired by Microsoft
as the primary author of their first OS. When he completed his work on IBM's
Personal Computer™ DOS 1.00 in 1981, his DEBUG.COM utility
was included with it. All the functionality that Tim put into DEBUG is still
there and little has been added to it (the major exception being the Assemble
command; added under DOS 2.0).
[ Thanks go to Tim Paterson himself for reviewing
this perspective on DEBUG's beginnings. ]
With the release of DOS 2.0, DEBUG gained the ability to assemble instructions directly into machine code (the A command). This is one of the most important commands for many of its users. Though lacking much of the functionality of a stand-alone Assembler, e.g., all Jumps must be to hexadecimal addresses (no labels can be used), many useful .COM programs have been assembled with this command. Under DOS 3.0, the P (Proceed) command was added, so DEBUG could quickly execute subroutines; at the same time, it became possible to attempt stepping through Interrupts with the T (Trace) command. When DOS made EMS (Expanded Memory) functions available under DOS 4.0, the four commands xa, xd, xm and xs were also added to DEBUG. It appears they were rarely, if ever used though, even by programmers. For most of us, the only noticeable change in DEBUG was the addition of the help command (type a '?' while inside DEBUG) under DOS 5.0; when all DOS commands finally got the /? command-line switch.
DEBUG's code went through a number of changes (and 'bug fixes' too) over the years! Some of these internal changes were related to DOS system calls and screen output, then there was the change in file type from a .COM to an .EXE program under DOS 5.0. But in spite of all those changes and others which followed, DEBUG has never had an official revision since 2.40 (those digits have been embedded inside all versions of DEBUG since DOS 3.0). We can only guess about the real reasons that Microsoft® never updated DEBUG to handle instructions beyond those of the Intel® 8086/8087/8088 processors. Microsoft® did create their own Assembler (MASM), 'C' compiler and Debugger (CodeView ); which you could use too, if you were willing to pay extra, so that could have been one of their reasons. Rather than using MASM and CodeView, many opted for the less expensive Borland® assembler (TASM) and Turbo™ Debugger when they appeared, or some other commercial product. However, users and students alike can still learn a great deal about Assembly language by using DEBUG.
The internal structure of these Windows® versions of DEBUG appear much different than any previous DOS forms; at least at first glance. Though it seems a great deal has changed, you'll still find the phrase "Vers 2.40" but in a different location. Windows® itself went through a lot of changes during this period, such as being able to handle a new file system, FAT32, and larger drives. But without access to its source code, we can't be sure if there were any major differences in DEBUG. The changes might be due to something as simple as just reorganizing the error messages in the source code and/or using a new Assembler/Linker.
DEBUG had always been an effective tool in the hands of any Batch programmer, but some time after the introduction of Windows™ 95 and especially with Windows™ 98, that effectiveness was diminished when its I/O commands became unreliable! Whether due to a 'bug' in DEBUG itself or in Windows®, the fact is that I/O commands under Windows™ 9x/Me cannot be relied upon for direct access to a hard drive! If you run our ATA drive ID script under Win9x/Me, the data you get back is as interesting as it is disturbing: It appears that every other byte is still correct! So, one has to wonder what the cause of this problem might be.
The DEBUG program included
with Windows® NT/2000/XP/2003 appears to operate the
same as it did under DOS 5.0, but with two major exceptions:
1)
DEBUG is no longer allowed to load from or write
to any logical HDD sectors; only named files can still
be read from or written to under an NT-type OS. It can, however, still access
diskette sectors in the A:\ or B:\ drives
with the L and W commands, but only if those diskettes
contain a file system the host OS (2000, XP, 2003) can recognize!
(See the L
command in the Tutorial section for more
information.)
[ Note: DEBUG has never been able to directly access areas of an HDD outside of its drive volumes; such as an Extended partition table or even the MBR sector! However, DEBUG can be used to access such data by programming it to run INT13 commands or using a script file under DOS (e.g., our old CopyMBR script). Note again, that no Windows version after Win98/ME will allow INT13 access! ]
2) The I and O commands are essentially useless, since the program's interface with the rest of the system is only being emulated under these versions of Windows® rather than having any direct access to the hardware. This was already true to varying degrees under previous versions of Windows®.
This may surprise you: We
purposely mentioned the DOS 5.0 version of DEBUG here, since the DEBUG.EXE
file included with Windows® XP (and every other version
of the NT OS series) is exactly the same program file created
for MS-DOS 5.0 (md5sum = c17afa0aad78c621f818dd6729572c48).
DEBUG was only one of a small handful of DOS 5.0 programs that didn't
require any changes to run under an NT operating system. It's almost
ironic that another of those few programs is EDLIN, a line editor disliked by
most DOS users. Though EDLIN was also created by Tim Paterson, he did so in
just two weeks and was shocked when he heard IBM had actually included
it in their PC-DOS 1.00 release! No doubt he wished it had been replaced by
something better way back in 1981. It wasn't until the release of DOS 5.0,
that EDLIN was effectively replaced by Microsoft's EDIT.COM
program (v 1.0, 1991. Note: This
first version of EDIT required QBASIC to also be present); EDLIN was, however, still
retained, to be 'backwards compatible' with various 3rd-party Batch files. Though NOTEPAD
or more advanced editors are available under Windows™, you can still use
the 1995 standalone version of EDIT (v
2.0.026) at Command Line prompts in Windows™ XP; its menus will
even respond to mouse clicks.
Though created at the beginning of the 16-bit processor era (before the 80286 existed), more recent versions of DEBUG (such as those found inside a Windows™ Me or 98SE Emergency Boot Diskette's EBD.CAB file) are still useful to PC techs for direct access to certain memory locations on present-day systems (an Intel® Pentium™ IV, for example). DEBUG can also be quite useful for educational purposes. And even for debugging the Assembly code that is required during the boot process: The software that checks the Partition Table on hard disks and loads OS Boot Sectors into Memory. Unfortunately, many Boot Managers and recent MBR sectors now use instructions requiring a 386 (or even 486) class CPU to function, making it difficult to use DEBUG for such a purpose. Because of the backward compatibility of most Intel® processors, and the fact that it was included with Microsoft® Windows™ XP and 2003, DEBUG has had a much longer life span than ever expected. Though the ITANIUM™ CPU was not x86-compatible, the AMD64 was. In 2005, Intel® made the so-called "x64-based" CPUs that were once again x86-compatible. So, DEBUG still continues to find some use on 64-bit computers, even my Intel® Core™ 2 Quad (4 processors in one) machine.
Yes, DEBUG and some other early DOS utilities were removed from the Command Line of the 64-bit
version of Windows 7, and will never again appear in any new Microsoft OS. However, it's been possible for a few years now to run IBM PC DOS 1.x0, 2.x0
and 3.30 (possibly others) along with their versions of DEBUG in a small window under Windows XP (32-bit), Windows 7
(64-bit), 8 and even the latest update of Windows 10 (Anniversary)! Read here about the PCE (PC Emulator) program by Hampa Hug. Of course, if you wish to run the last version of MS-DEBUG from
MS-DOS 6.22 or the 32-bit Debug clone we recommend below, you may need to install BOCHS, QEMU or some other emulator, or VPC, VirtualBox,
VMWare Player or some other type of virtual machine software. But what's cool about PCE is that you'll be running the OS under the actual ROM BIOS
code used in a physical IBM PC. It should be noted that BOCHS itself can also be run as a powerful
visual debugger! (SEE our Bochs Debug page for more on that.)
For some years now, we've been using a 'clone' of MS-DEBUG which started as the DEBUG
program for FreeDOS, but has since had even more improvements made. You can download and use this program for free; currently we recommend
a page made for it on a site created by Vernon C. Brooks, who had been a Senior programmer for IBM's PC DOS 7.0, the remainder of his site
deals with the history of IBM PC DOS, and is very informative (PC DOS Retro):
Enhanced DEBUG (current version, since MAY 2016, is 1.32b).
I finally found it still available from there: Download DEBUGX 1.32b.
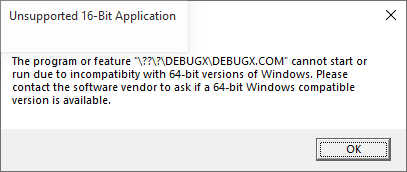
Unfortunately, just as with MS-DOS DEBUG itself, DEBUGX is also 16-bit, so it will not function under any 64-bit Windows OS;
attempting to do so will result in this error message:
C:\DEBUG> DEBUGX -? assemble A [address] compare C range address dump D[B|W|D] [range] dump interrupt DI interrupt [count] dump LDT DL selector [count] dump MCB chain DM dump ext memory DX [physical_address] enter E address [list] fill F range list go G [=address] [breakpoints] hex add/sub H value1 value2 input I[W|D] port load file L [address] load sectors L address drive sector count move M range address set x86 mode M [x] (x=0..6) set FPU mode MC [2|N] (2=287,N=no FPU) name N [[drive:][path]filename [arglist]] output O[W|D] port value proceed P [=address] [count] proceed return PR quit Q register R [register [value]] MMX register RM FPU register RN[R] toggle 386 regs RX search S range list trace T [=address] [count] trace mode TM [0|1] unassemble U [range] write file W [address] write sectors W address drive sector count prompts: '-' = real/v86-mode; '#' = protected-mode - |
DEBUG was originally designed to work with .COM programs having a maximum size of only 65,280 bytes [ (64 x 1024) - 256 ] or less; how much less, depended upon the maximum number of bytes the program had to place on the Stack at the same time. The subtraction of 256 bytes is necessary since DEBUG often uses the area from offset 00 through FF hex for some internal data such as the name of the file that was loaded. Remember, true .COM programs by definition are supposed to fit inside a single Segment of memory (only 64 KiB).
Even when running MS-DEBUG under the latest Windows® OS, since it's still an old 16-bit DOS application, you can only open files whose names have been saved in the 8.3 DOS convention; i.e., up to 11 characters total, using no more than 8 DOS characters for the name and 3 for the extension.
As early as DOS 1.10, DEBUG was able to load files larger than 64 KiB. Basically, how large a file that DEBUG can safely use without error depends on the amount of available memory and the way the OS handles memory management. We'll say more about this below.
|
Remember: The Segment assigned to DEBUG, depends on the amount of memory in use, not the total memory available. So, the same DOS machine, whether it has 16 or even 4096 MiB of memory, will generally load DEBUG into the same Segment; unless a "terminate and stay resident" program is using that memory, or memory was not properly deallocated prior to running DEBUG.
Any version of DEBUG from DOS 2.0 or higher, makes use of the operating system's EXEC function which means that it's possible for you to perform a limited amount of debugging on an .EXE program. However, DEBUG can never be used to save either an .EXE or a .HEX file to disk, since both of these file types contain extra data that DEBUG was never programmed to create after EXEC removed such data! It is quite possible though, to change the extension of an .EXE file, for example to .BIN, so DEBUG can be used to edit such a file, then change it back to an .EXE extension afterwards. Normally we'd recommend using a Hex editor instead, but would like to point out that DEBUG could be used with Batch files and scripts to carry out such edits automatically; taking the place of a Patch program.
One of the simplest .EXE programs you can run under DEBUG is the so-called DOS "Stub" found inside many Windows® executables. You can follow along as we examine one of these here!
There will always be some code and data placed within the first 256 bytes of the Segment for DEBUG's own use. And although DEBUG often functions as expected if you zero-out this area, there may be some cases where you wouldn't want to alter its contents. The code bytes are simple and always found in the same locations: The first two bytes of this area ("CD 20") are machine code for the DOS interrupt: INT 20. The bytes at offsets 50h and 51h ("CD 21") form an INT 21, and the byte "CB" at offset 52h is a RETF instruction.
|
When running DEBUG in a Windows® DOS-box (under CMD.exe), dumping its first 256 bytes will almost always show the same fragmented string (shown below in white text). The characters are the remains of the Ntvdm program (which starts as soon as any 16-bit command is run) quickly reading one line at a time from the file AUTOEXEC.NT (located in the C:\WINDOWS\system32 folder), into the same area of memory where command line parameters are stored. The longest line in that file, including its trailing 0Dh (carriage return) byte, is successively overwritten by shorter lines in the file until the process results in what's copied to offsets 82h through CEh of DEBUG's Segment:
|
Note: If you rename or delete AUTOEXEC.NT, you will not be allowed to run DEBUG (nor any other 16-bit program; all of which must run under Ntvdm). You can, however, save a copy of AUTOEXEC.NT, then edit it to see how your changes affect what's copied into DEBUG. You may reduce its size to just a single byte. But in order to see anything other than zero bytes in offsets 82h and following, at least one space byte (20h) must be placed between a non-space byte at the beginning of a line and whatever you'd like to have displayed. If the file contains only the 3 bytes: "T", space and "S", then offsets 82h and 83h would be an "S" followed by 0Dh.
This section is presently a "Work in Progress", but if you happen to see this before it's finished, can you guess what it's about?
Although almost all the code used by programmers performs exactly as expected; once they've eliminated their own errors in logic that is, occasionally it will produce surprising results because they didn't dig deep enough into the fine print of the user manuals for a PC's processor. Professional programmers will always test their code in as many ways as reasonably possible, but studying the processor's programming notes; especially sections pertinent to any of their tasks, should be high on their list! NOTE: If you want to be a much better hacker, the example presented here might cause you to delve into Intel's detailed notes on how their CPUs handle various instructions.
Have you ever encountered two distinct lines of Assembly instructions that DEBUG always steps through without ever stopping at the second line? The following is just one of MANY repeatable examples we could list here. Open any instance of DEBUG (DOS or Windows; any version), and copy and paste the following E (Enter) command at its (-) prompt:
e 100 8C C8 8E D0 B0 74 90 90
After entering "u 100 107" it should disassemble to:
 xxxx:0100 8CC8    MOV   AX,CS  <- Keep Stack in CS Segment.
 xxxx:0102 8ED0    MOV   SS,AX  <- The key instruction!
 xxxx:0104 B074    MOV   AL,73  <- Could be almost anything.
 xxxx:0106 90      NOP
 xxxx:0107 90      NOP
Now enter an "r" at the prompt and try to single step (t) through the code. As soon as you enter the t command at offset 0102h, you'll wind up at offset 0106h; every time! Is this some "bug" that was never dealt with? The instruction at offsets 0104h ff. could be almost anything; any 1-, 2-, 3- or even 4-byte machine code will do; we purposely picked one that would alter a register's contents (AL in this case) so you could see this instruction had indeed been executed by the CPU; without the user ever having a choice to do so.
This effect will always be observed no matter what version of DEBUG you run it under; MS-DOS 7.1, 5.0 or all the way back to the first version of DEBUG under IBM PC DOS 1.0 (no guarantee it would act the same if you ran it on an original PC though; we only have an 80486 and later for testing). However, if you expand your research to include other debugging tools, you'll soon realize the chances of every version of two or more tools having the same "bug" are... well, way too coincidental. So, why does this code affect a debugger's interrupt abilities?
If you haven't already reached for your Intel® Instruction Set Reference... What's that? You don't have one! Well, you'd better search for the keywords: Intel, IA32, Software, Instruction and at least download a PDF digital copy of the Instruction Set Reference! (Usually found as two separate files titled: Volume 2A: Instruction Set Reference, A-M and Volume 2B: Instruction Set Reference, N-Z). In my January 2006 copy under "MOV—Move", I found:
" Loading the SS register with a MOV instruction inhibits all interrupts until after the execution of the next instruction. This operation allows a stack pointer to be loaded into the ESP register with the next instruction (MOV ESP, stack-pointer value) before an interrupt occurs1." (IA-32 Intel® Architecture Software Developer’s Manual, Volume 2A: Instruction Set Reference, A-M, 253666-018, Jan 2006, "MOV—Move," page 3-584). And footnote 1. clearly states: "If a code instruction breakpoint (for debug) is placed on an instruction located immediately after a MOV SS instruction, the breakpoint may not be triggered." (page 3-585). For those who are new to how a debugger works, the "instruction breakpoint" which this refers to is not a breakpoint set by users, but rather the, let's call it, automatic breakpoint a debugger sets by itself on every single instruction users step into. So, according to these notes, what you may have thought was a "bug" in DEBUG, is in fact a processor doing what it was designed to do!
Does this mean we believe MS-DEBUG is completely "bug free"? No. In the future we'll post some examples here of real 'bugs' in DEBUG.
Before using any of the
debugging (Trace, Procedure) or Register commands, you
should familiarize yourself with the abbreviations for the CPU Registers
that are referenced in DEBUG (See the Appendix, The
8086 CPU Registers for all the details.)
You should also know about the SEGMENT:OFFSET Addressing method used by DEBUG (and other programming utilities).
|
A note about where and how DEBUG is used in a computer's Memory: Using DEBUG in a Windows® DOS-box (or CMD prompt) for the first time
could easily confuse you! If you open two instances of DEBUG (one per DOS-window) and examine all
the memory they can access, you might notice completely different data in many of the same memory locations! The reason is that each
application under a Windows™ OS is (theoretically) given its own 4-Gigabyte "Virtual computer" sandbox to
play in, and a copy of the critical data within the machine's first Megabyte of Memory is made for each running instance of
DEBUG. Only under 16-bit DOS, does DEBUG actually have access to the real Memory locations in which the operating system
itself is running; making it much easier to crash the whole system if an error is made. Under Windows®, the theory is that such
errors should crash only the open CMD window or application that caused a problem, but not the whole computer! At least that's how Windows®
is supposed to operate. From experience, it seems that Windows™ 2000/XP do a much better job at keeping control of their systems under the
same circumstances that often ended in Blue Screens on the displays of earlier versions! |
We recommend reading through the entire Tutorial on DEBUG before using these quick command links.
For a reminder of all the commands available while inside of DEBUG, simply enter a question mark (?) at the DEBUG prompt; when using DOS 5.0 or later.
Click on a command here for all its details:
-?
assemble    A [address]
compare     C range address
dump        D [range]
enter       E address [list]
fill        F range list
go          G [=address] [addresses]
hex         H value1 value2
input       I port
load        L [address] [drive] [firstsector] [number]
move        M range address
name        N [pathname] [arglist]
output      O port byte
proceed     P [=address] [number]
quit        Q
register    R [register]
search      S range list
trace       T [=address] [number]
unassemble  U [range]
write       W [address] [drive] [firstsector] [number]